Plastics Wastes in Singapore
Introduction
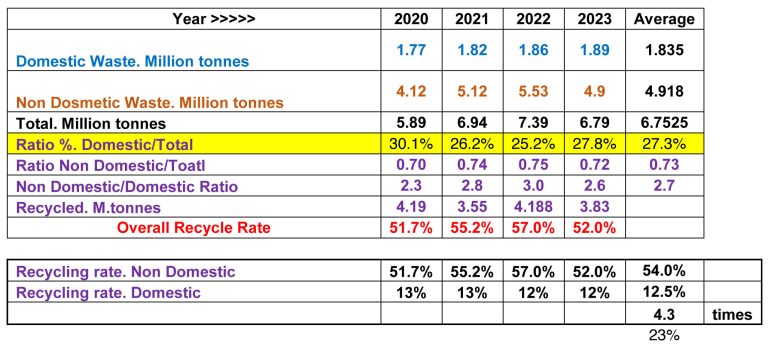
Let’s end 2024 with the really bad news so we can figuratively leave that in 2024. But we are really horrible in our plastics recycling. It’s almost nonexistent at 5.02% for 2023. Please read the breakdown.
There have been so many (countless) events and people preaching about having to reduce wastes. But preaching about what to do isn’t going to make much impact. Sad to say that plastic recycling has barely moved the needle.
The recycling industry needs more real support in many areas. Words of support and encouragement have tiny impact because we still need people on the ground to collect, sort, clean, and organize.
We don’t have infrastructure that can support plastics recycling, what with low gate fees, rising costs, and scarcity of labour. Let’s venture beyond talking and focus more on really supporting the industry. The elephant in the room will only grow bigger.
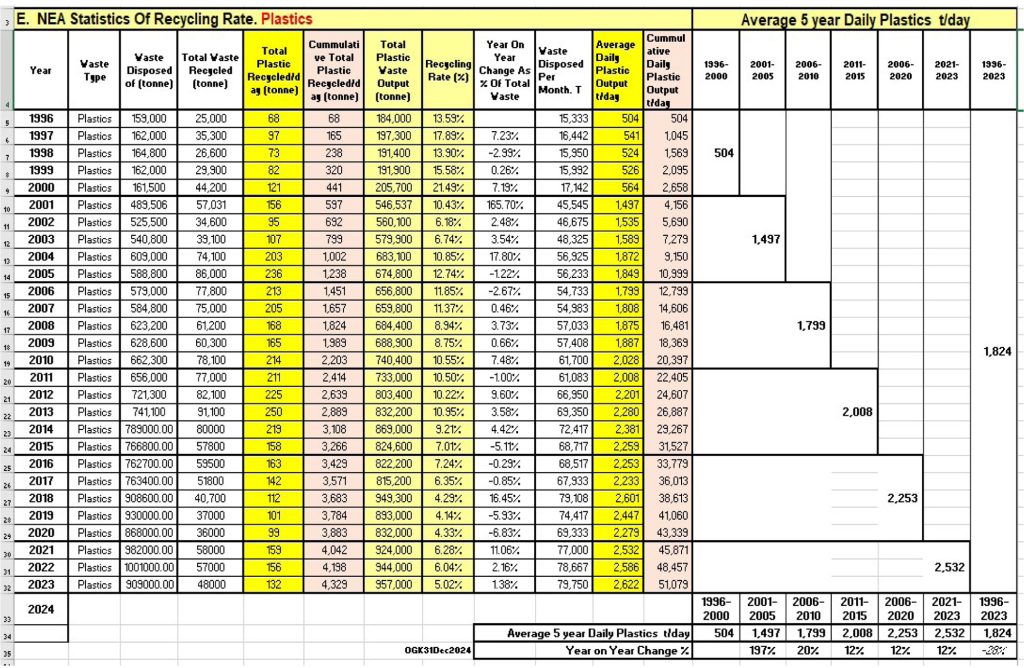
Plastic recycling was so low for 2023 at 5.02% that it is scraping the barrel, and it has been single digits since 2014 when it was 9.2%.
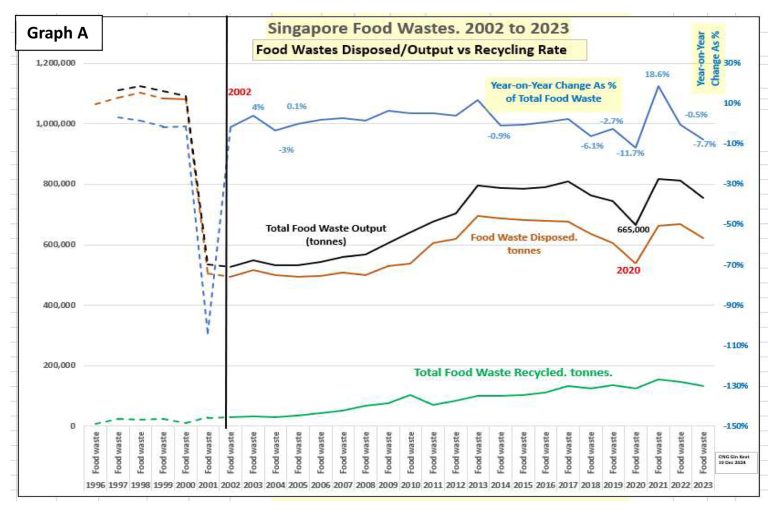
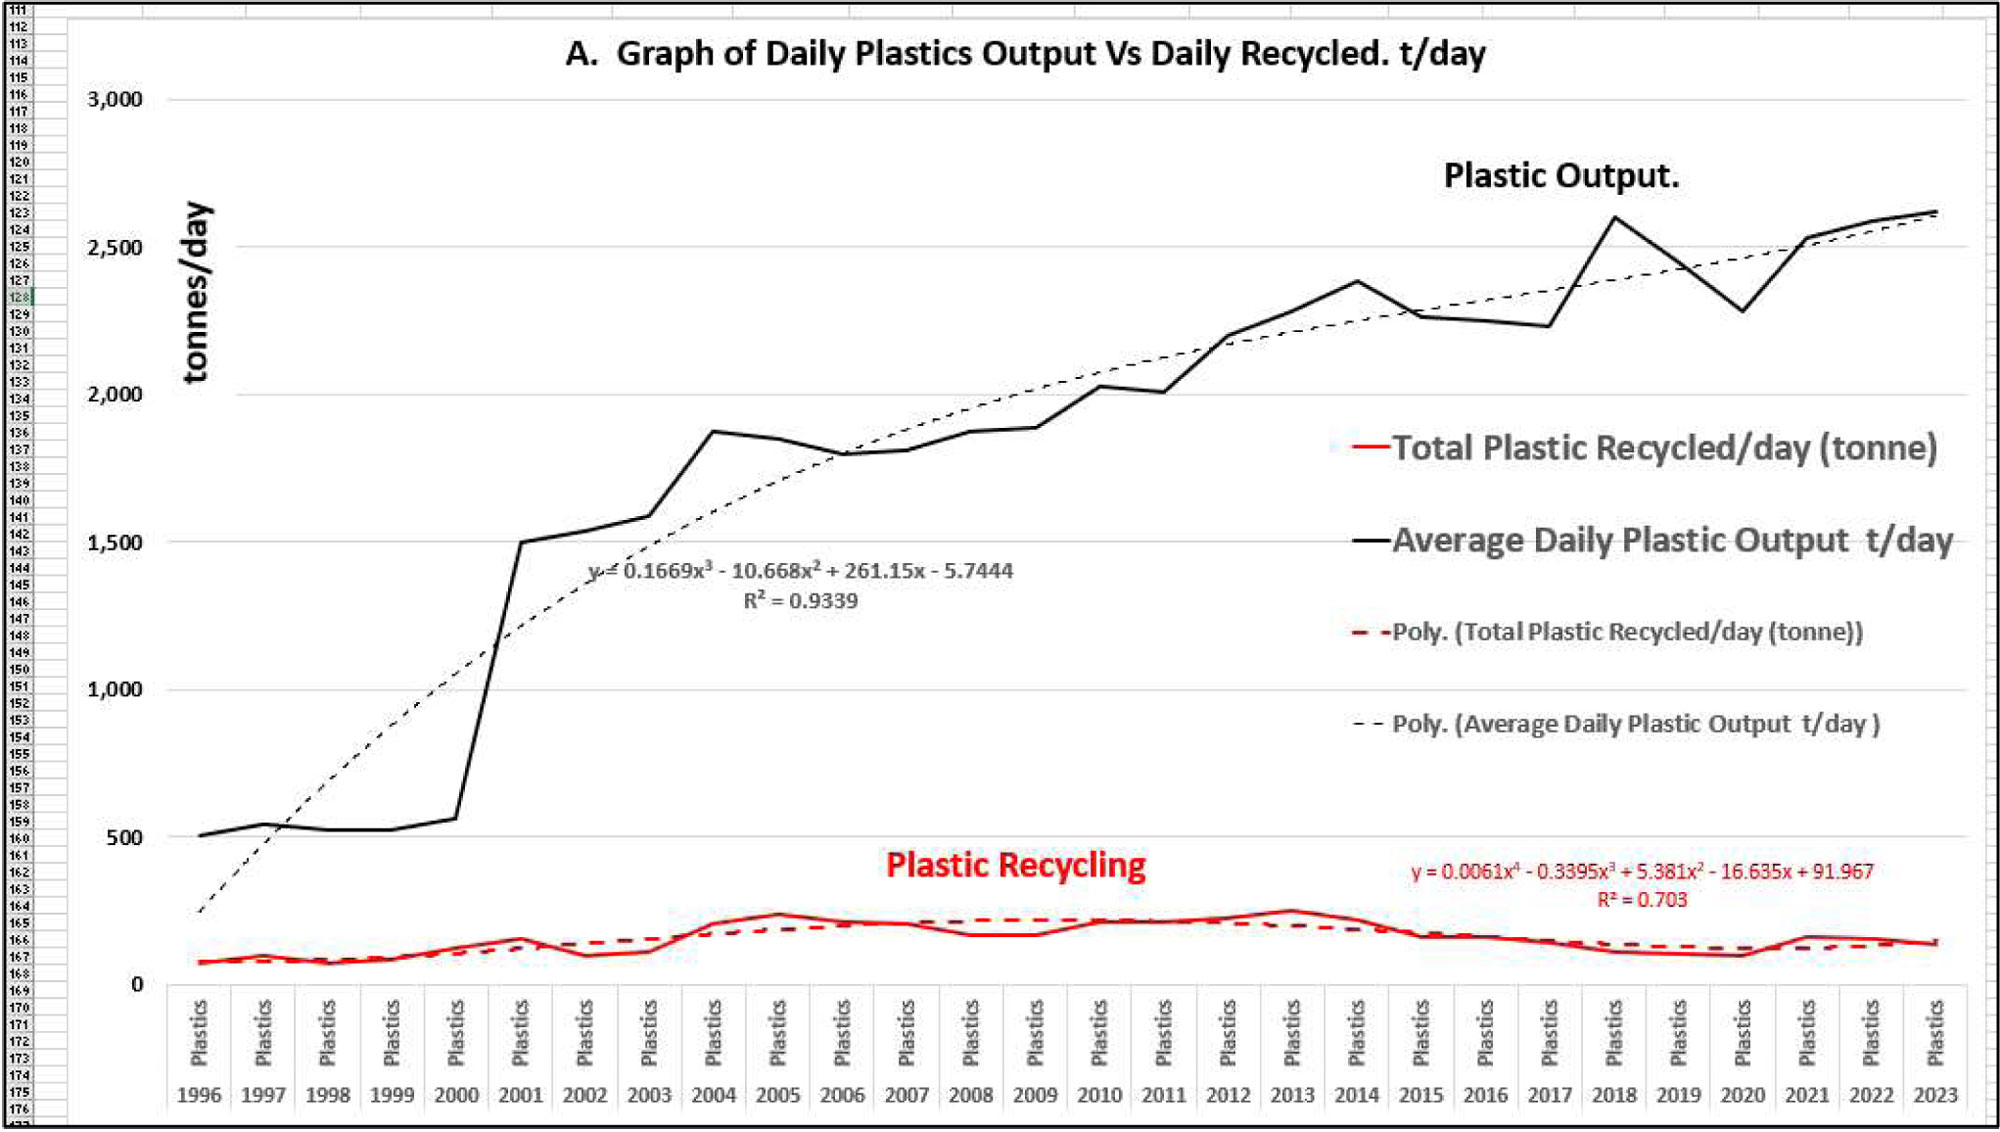
Graph A – Plastic output as a waste has been growing at around 12% or more annually since the start of this century. So, in spite of various campaigns to recycle, plastic waste has grown even bigger. While a small portion can be said to be incinerated as part of the fuel mix in the incineration plant, 2023’s plastic waste was 909,000 tonnes or 2,622 tonnes/day.
It’s quite clear that plastics waste will continue to grow, so we need to get into the mode to reduce and recycle.
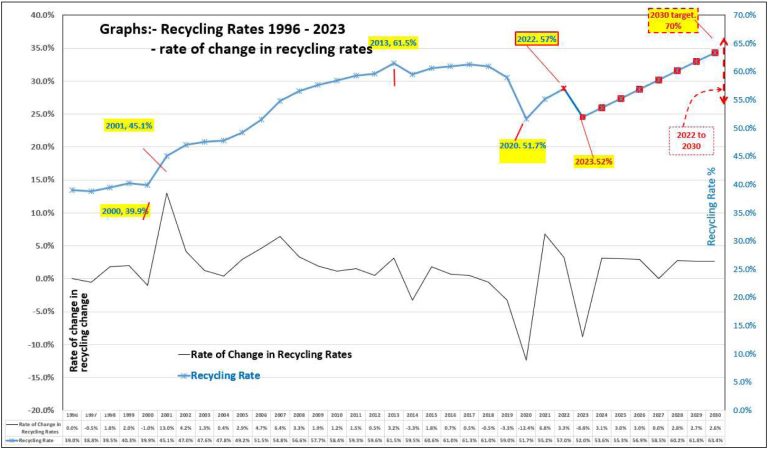
Graph B below shows the year-on-year change (the orange line) – that means every year there has been little improvement in plastics recycling. Unfortunately, the way we compile and release waste data means we will only know the recycling statistics for 2024 around 2Q 2025, which does not leave much time for corrective actions before 2030.

Graph C
Taking the average in five-year periods, there is steady plastic waste growth since 2001.
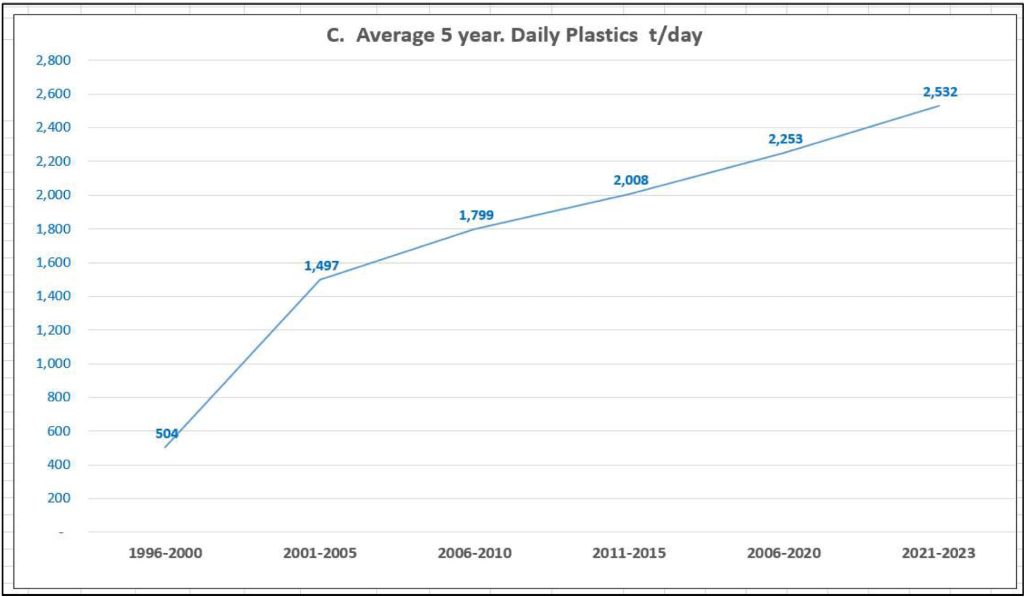
A projection with no recycling growth means plastic waste will just shoot out of the graph.
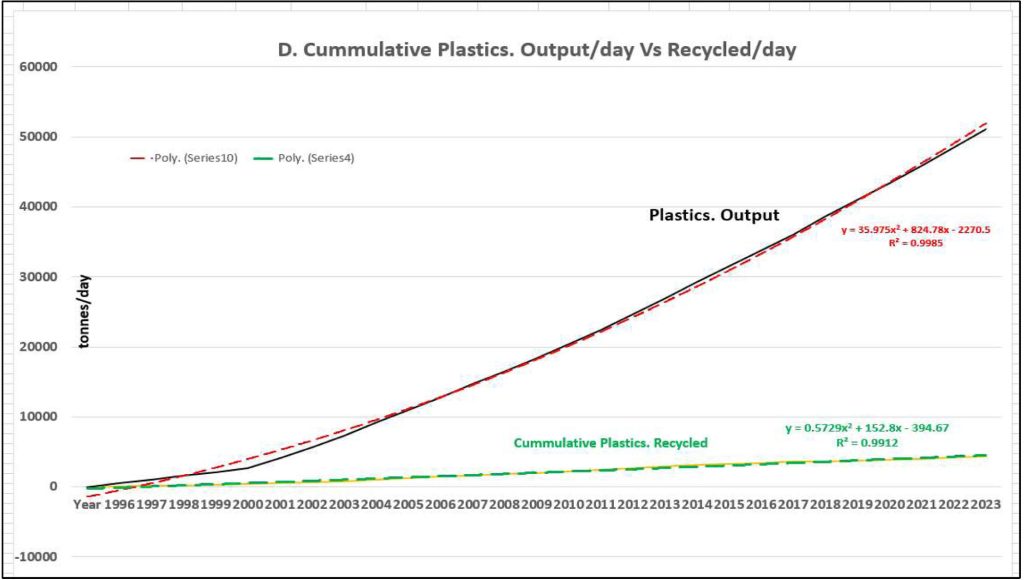
Graph D
The cumulative graphs show a scenario that the 2030 target is unrealistic, so plastics is a very key item that needs more support, which is already too late.
Graph E – NEA Plastic Wastes