Food Wastes Recycling
Food Wastes Recycling
This is NOT a comfortable subject, but it is what it is.
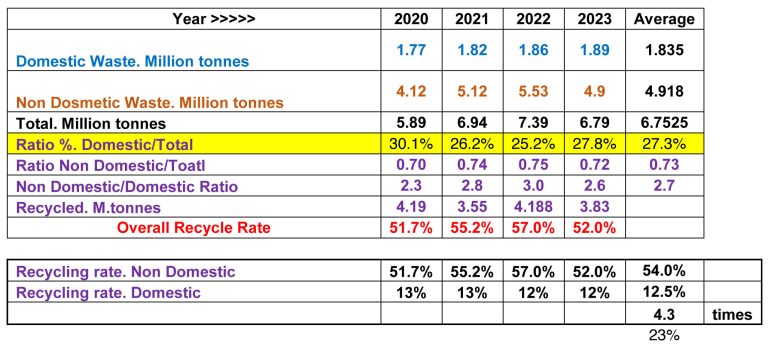
Food waste is a big part of domestic waste, which in turn makes up just 27% of the total waste disposed of in Singapore. The other 73% comes from the non-domestic sector, which is mainly industrial and commercial waste with a higher recycling rate. Twenty-seven percent is a small ‘engine’ and cannot be driving Singapore’s overall recycling rate statistics.
Nonetheless, we have to try even harder, or the recycling rate will face steeper challenges in the future.
Food Wastes Recycling
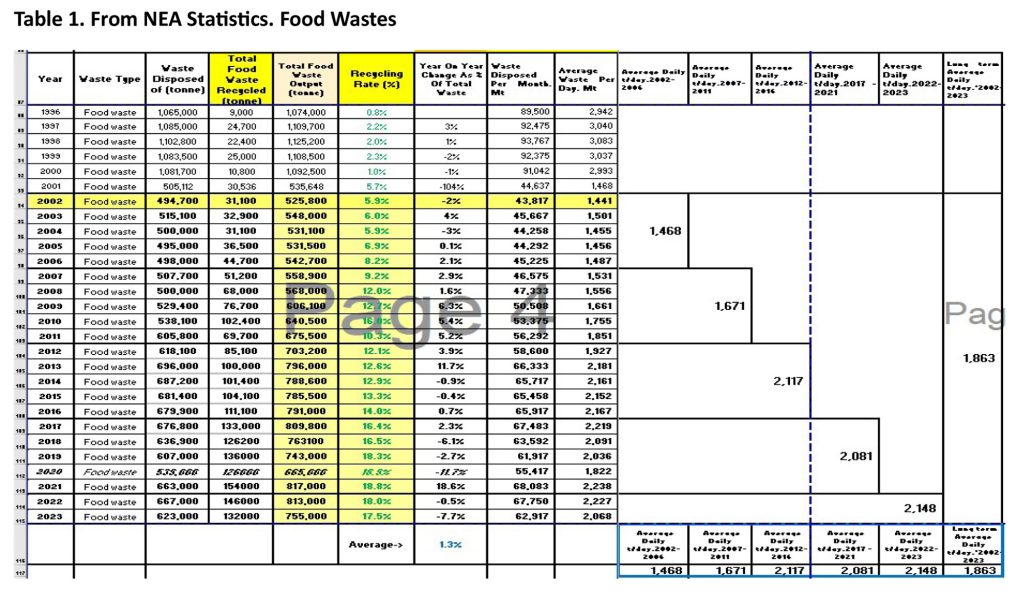
Singapore’s food waste recycling rate—a forever teenager, stuck in the teens since 2012 (Table 1 statistics)—has stagnated over the last seven years. When and how will the recycling rate go or grow up? This is one of the elephants in the Singapore room. (There are other elephants.)
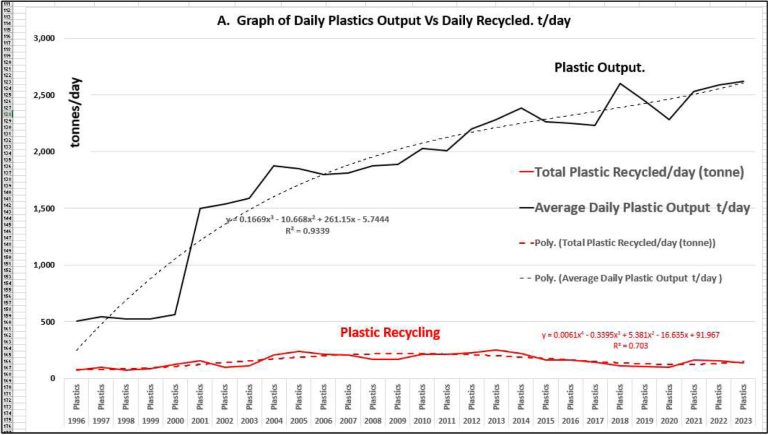
Graph A
In 2000, there was a big data change, which was adjusted in 2001. Data from 2002 was used as the start of accurate and reliable records.
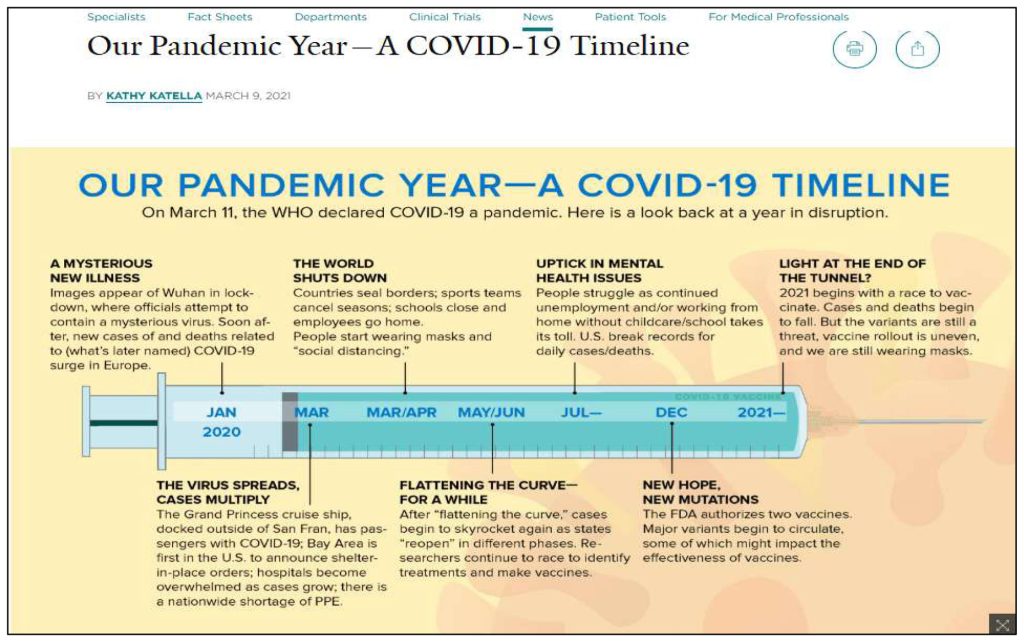
In Graph A, the data are in tonnes of food waste output. In 2020, when COVID-19 struck globally, economies were upended in days. These disruptions affected whole industries, including food production, logistics/shipment, consumption, and manufacturing.
2020 saw a steep drop in food waste generation, reflecting the impact on the manufacturing industry and supply chains, which were almost paralyzed. A new normal is still forming. To be clearer, pre-2002 data for food waste were excluded and simplified, as shown in Graph B.

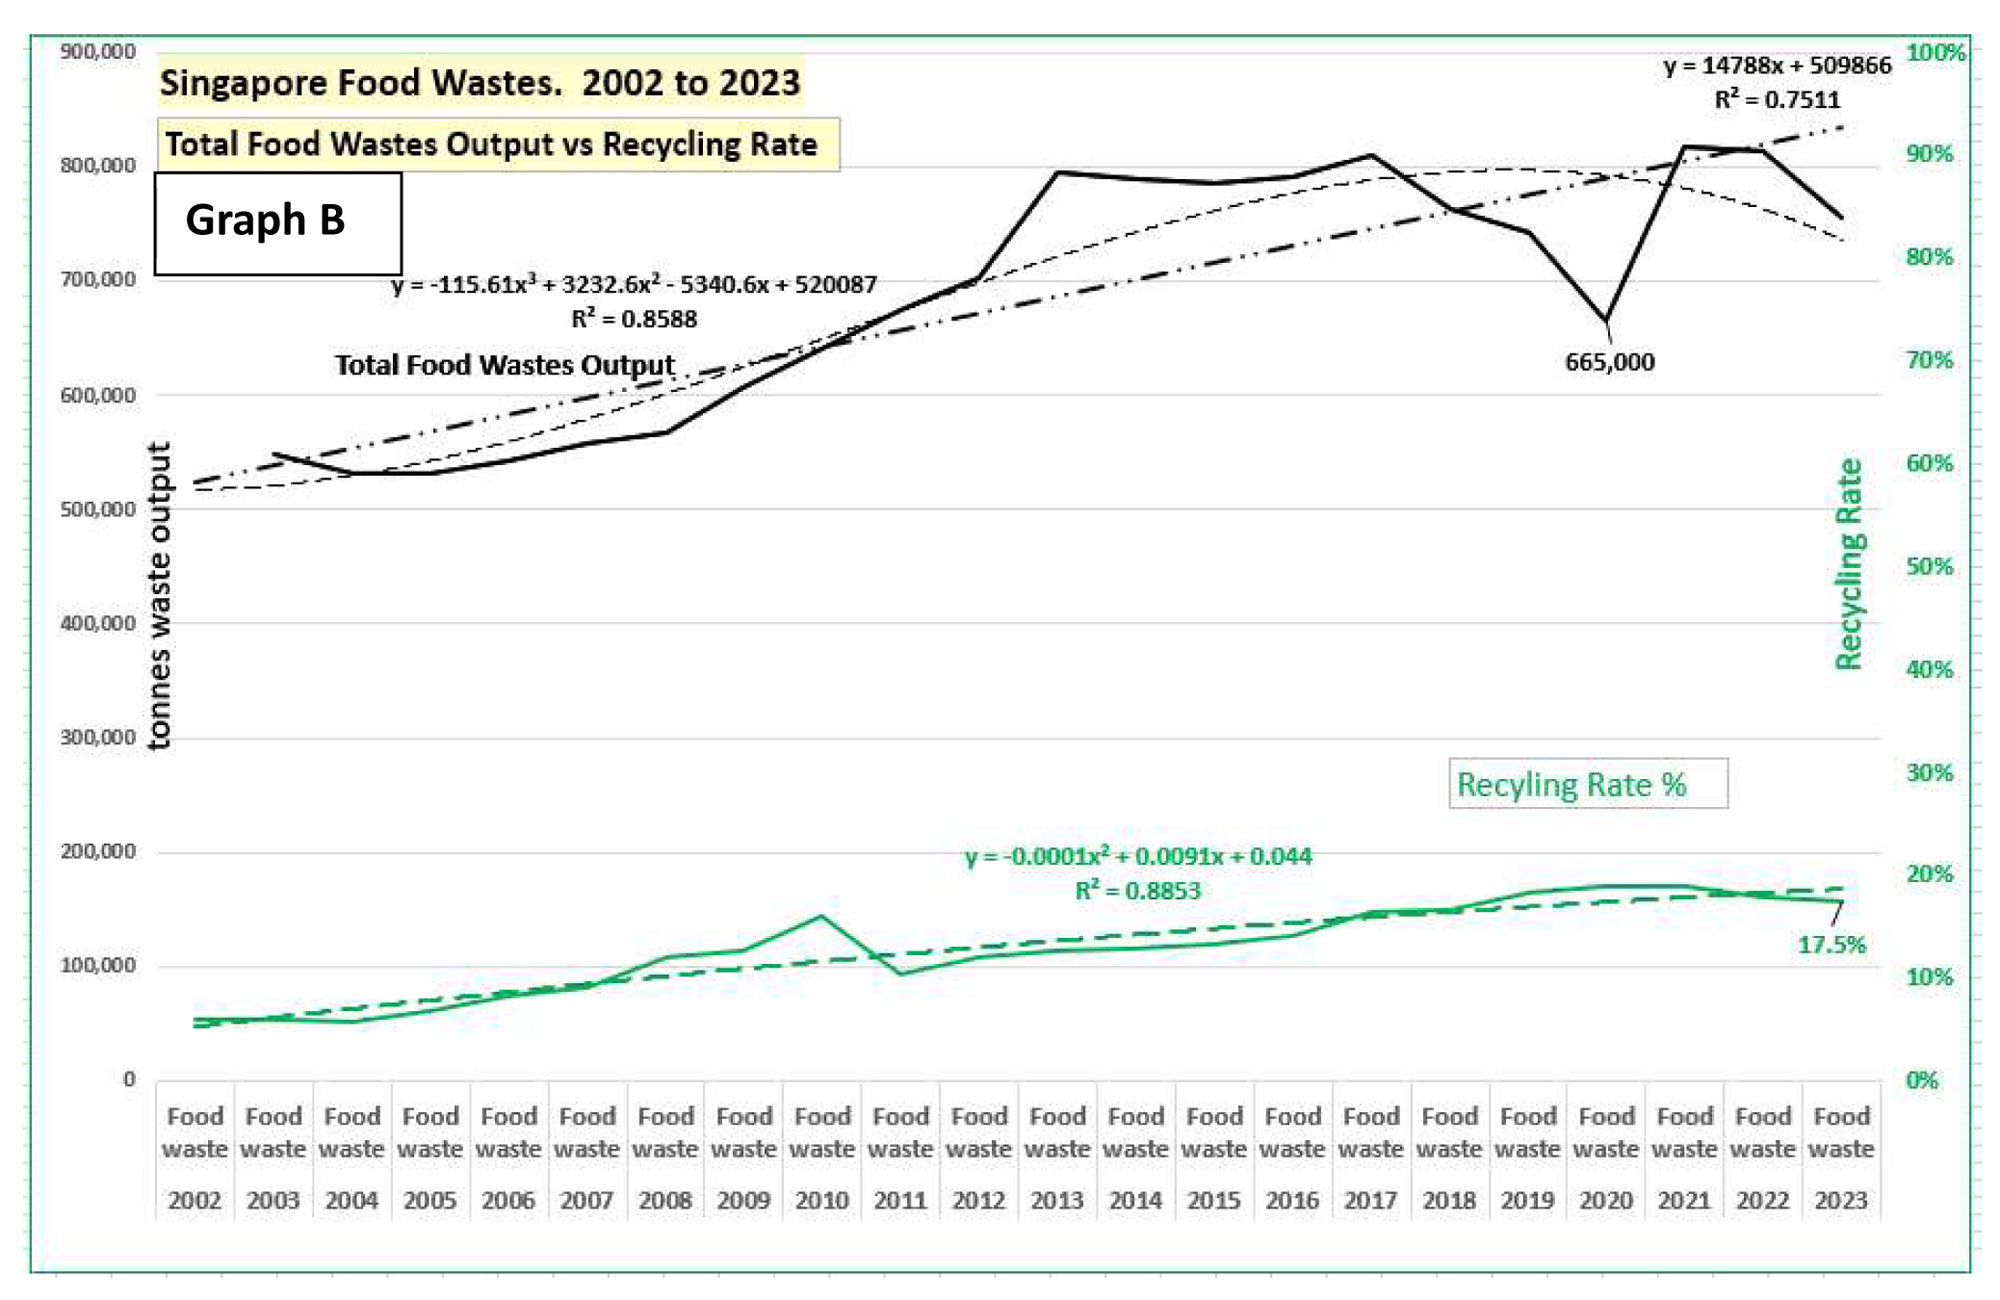
Graph B
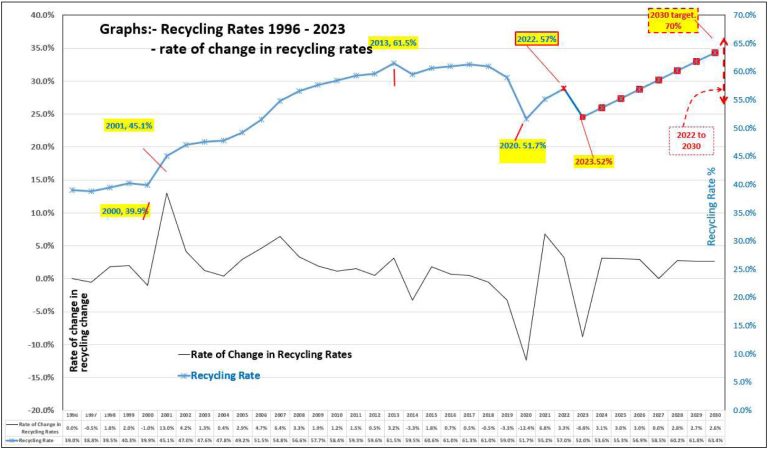
Starting with the year 2002, the simplified graph shows total food waste output and the food waste recycling rate.
Visual inspection shows the two trendlines in an upward direction, with food waste quantum growing at a higher rate than the recycling rate.
The growth in food waste output is expected, given that the food manufacturing industry is a large part of Singapore’s manufacturing industry. As in many things, Singapore imports almost everything, be it oil, milk powder, or raw/semi-processed materials. These are processed into higher-valued materials and services.
However, it should be noted that in such processes and services, waste materials, offcuts, etc., are generated. While the finished products/services can be exported, the waste or side streams generated CANNOT be exported in its raw waste form. Such wastes/side streams have to stay in-country and need to be semi-processed or processed into higher-value products or end up in our sole landfill at Pulau Semakau.
As Singapore’s economy grows along with global economic growth, waste will be generated. Equally, if the global economy falters, Singapore’s economy will be impacted.
Unfortunately, the gap between economic growth and our recycling rates will continue to widen unless drastic action is taken or should have been taken years ago. Is it a case of too little, too late? Is that achievable? How?
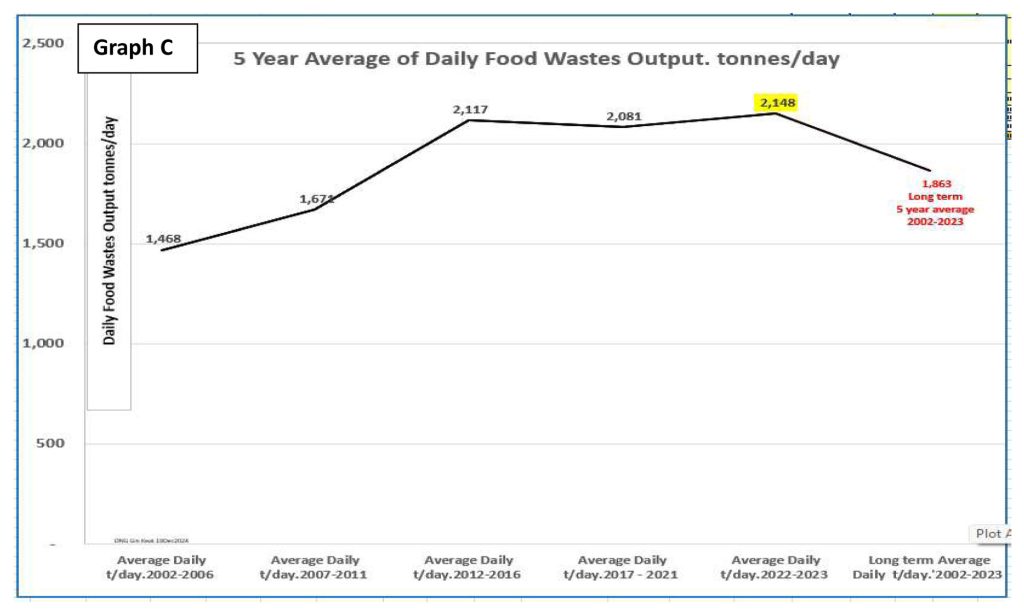
Graph C – A Reality Graph
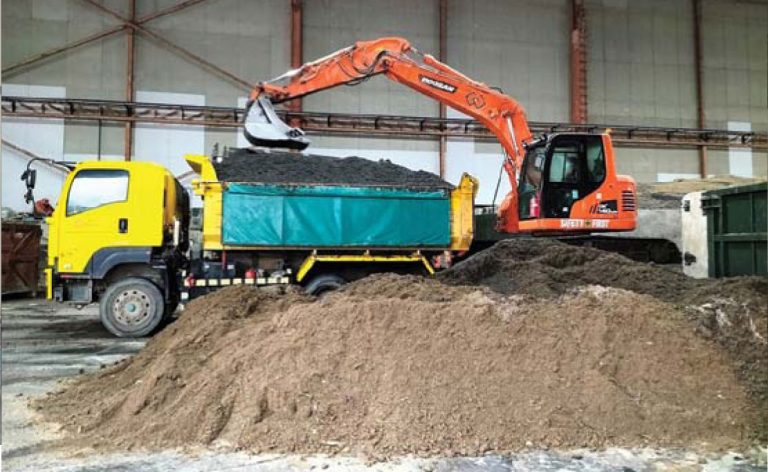
Taking in five-year time frames, the statistics show our average daily food waste output as 2,148 tonnes/day or at least 107 fully loaded trucks every day. If we take data from 2002 to 2023, the average long-term figure is 1,863 tonnes/day, a 15% reduction.
There are no easy answers. But it is better to go beyond talking and emphasize the doing and actions to be taken. Try and test new and different ways:
- Provide better support for those already in the recycling industry with manpower and resources, reduce overheads, and increase access to manpower (Singaporeans and foreign).
- Offer special support to NGOs and social enterprises that work on reducing and valorizing waste.
- Encourage small-scale waste-to-energy innovations and developments with less bureaucracy and more grants, especially those at Technology Readiness Level 7 and above.
- Work on announcing waste statistics earlier and even every six months.